
Credit scoring at LIFT
Here at L-IFT, we have worked to develop a robust credit scoring system based on the diaries data that we collect as well as one-time surveys. The aim of credit scoring is to classify loan applicants into two categories: those with ”good credit” and those with ”bad credit”. We have focused on credit scoring for microfinance institutions, which is an area with limited research.
The literature on credit scoring in microfinance is less broad than that of the general credit scoring literature. Currently, various techniques have been applied, these include parametric techniques like logistic regression and non-parametric techniques like random forest.
There is no consensus on which methods work well for credit scoring in microfinance as the effectiveness of the method is often dependent on the type of data that is available.
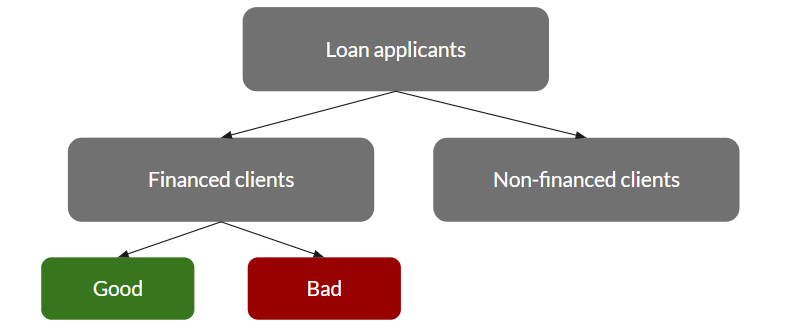
One of the major concerns in credit scoring models is sample selection bias. This problem occurs when a model based on applicants who have received a loan in the past is applied to new applicants (as shown in the figure below). The bias may be caused by various missingness mechanisms. The different missingness mechanisms that can occur are Missing Completely at Random (MCAR), Missing at Random (MAR), or Missing Not at Random (MNAR) (Little and Rubin, 2019). As mentioned, several credit scoring models have been applied in a microfinance setting however, the problem of sample selection bias is not addressed (Van Gool et al., 2012).
The data
The data comes from various sources and spans different countries. We have data on demographics, business environment, and past loans as well as other data based on our one-time surveys.

The Models
Logistic regression
Logistic Regression is one of the most used credit scoring models in microfinance institutions (MFIs) because the model is easy to estimate and interpret (Van Gool et al., 2012). This parametric model estimates the probability of default, based on a set of explanatory variables. From the probability of default, a binary outcome variable can be deducted.
The coefficients of the logistic regression model are estimated by maximum likelihood estimation.
Fuzzy augmentation
Contrary to the logistic regression model, the fuzzy augmentation method takes the sample selection bias into account (Crook and Banasik, 2004). With fuzzy augmentation, we estimate a posterior probability model using the data of the financed clients. From this model, we extrapolate the probability of default for the non-financed cases. Then, a new credit scoring model is estimated based on the extrapolated dataset containing both the financed and the augmented non-financed groups.
Extrapolation
The extrapolation method is similar to the fuzzy augmentation method (Anderson, 2007). However, instead of augmenting the data with two weights, we add a single observation to the dataset. This observation is the predicted outcome of the logistic regression model, indicating whether we predict a non-financed to be a default case or a non-default case. Assume the same setting as used in the fuzzy augmentation method where we have ‘n’ financed clients and ‘m’ non-financed clients.
Bivariate probit
Heckman’s bivariate two-stage model Heckman (1979) has been used for sample selection inference problems and was applied in a credit scoring context by Banasik et al. (2003). It assumes that the distribution of financed clients is different from the distribution of non-financed clients.
Models monitoring and evaluation
Discriminatory power
The discriminatory power of a credit scoring model gives an indication of how well the model performs at distinguishing the default group from the non-default group. The Gini coefficient and Kolmogorov–Smirnov (KS) statistic both measure the discriminatory power of the model. Both the Gini coefficient and KS statistic take values between 0 and 1 and a higher value means that the model performs better.
Classification accuracy
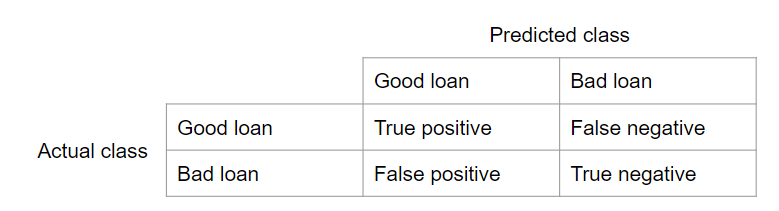
Classification accuracy gives an indication of how well the models classify each client. Measures of classification accuracy are often based on a confusion matrix. The two measures that we use are sensitivity and specificity. Sensitivity is the amount of correctly classified default cases and specificity is the amount of correctly classified non-default cases.
Explanatory accuracy of the probability forecast
The credit scoring models that we use, base their classification on a probability of default. There are various measures that indicate how good the probability forecast is. For this, we specifically look at the calibration and sharpness of the probability forecast. The calibration performance is evaluated by the Hosmer–Lemeshow (HL) test and calibration curves. The sharpness (subject to calibration) is measured by the Brier score or the logarithmic score.
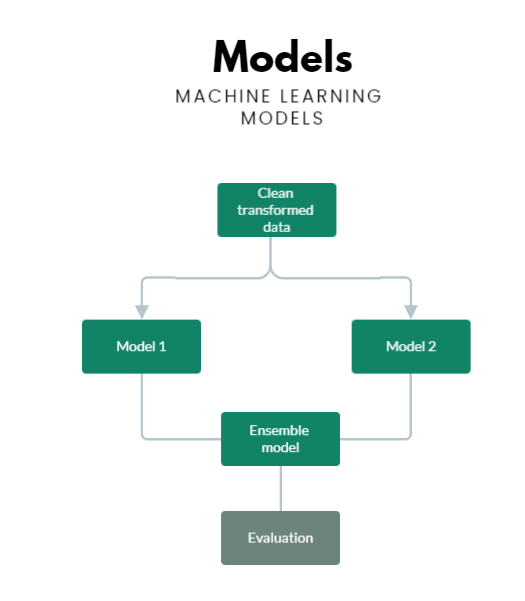
The entire data pipeline
The following is the data pipeline currently in use and the technologies that we have applied at each stage. The pipeline includes pulling data from various sources, cleaning the data, and making several alterations and transformations. We then apply machine learning to the data and then make credit evaluations based on the models to new clients.