From the census result, eligible firms were selected to get the right mix of businesses for the study. Among those who were selected, 31 firms refused to sign consent to participate in the intake. To describe their demographic profile, 29 percent (n=9) were female owned; 52 percent (n=16) were male owned and 19 percent (n=6) were both female and male owned businesses. Firms that have 6 to 20 employees showed more refusals to sign the consent form (42 percent; n=13). This is followed by firms that have 3 to 5 employees (32 percent; n=10) and 2 employees (23 percent; n=7). By industry, 45 percent (n=14) were from light manufacturing; 19 percent (n=6) were from agri-businesses and 35 percent (n=11) were from ‘other’ category (this is very close to the overall distribution across these industries, which means that the percentage of refusal was more or less the same for each industry). Regarding location, most of the refusal came from Addis Ababa (81 percent; n=25) followed by Adama (16 percent; n=5) and Harar (3 percent; n=1).
The field researchers successfully interviewed 379 business firms using the intake survey. Like the census results, the location distribution, the sector distribution is the direct result of the distribution of field researchers in this area. Addis Ababa has five Field-Researchers, Adama-three, Harar-two and Dire Dawa-one. Accordingly, the following describes the findings from each question.
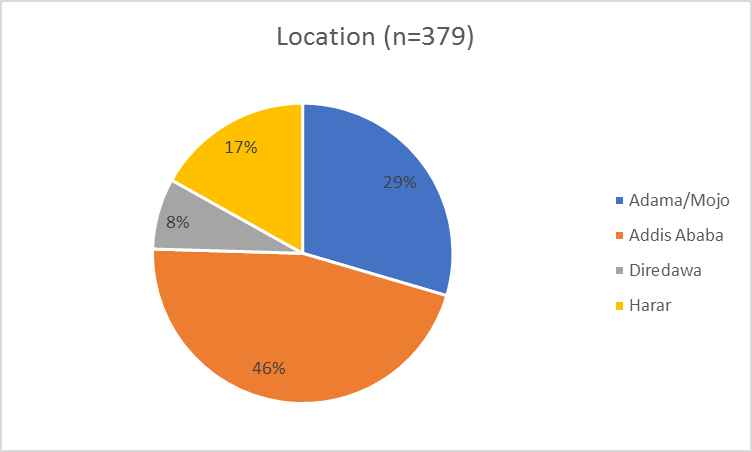
# Location
The intake interview took place in 4 locations with the highest number of interviews in Addis Ababa (47 percent); Adama/Mojo (29 percent); Harar (17 percent) and Dire Dawa (7 percent).
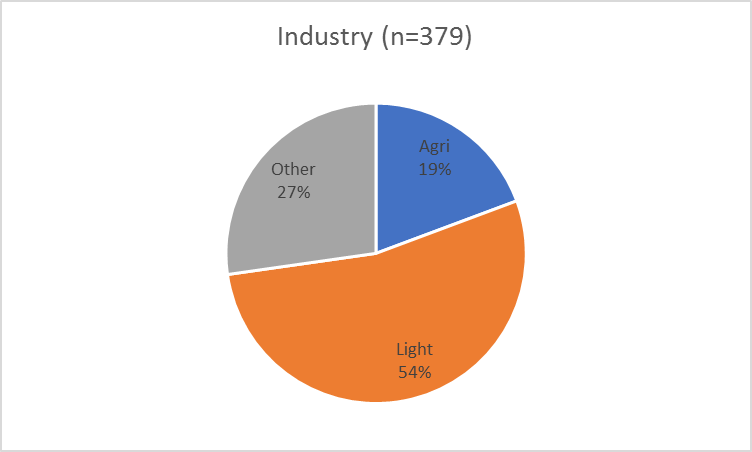
# Industry
Regarding industry: the intake interview was done with the light manufacturing (54 percent); agri-processing (19 percent) and other (27 percent). The intention was to achieve about 1/3 of each industry based on the census result.
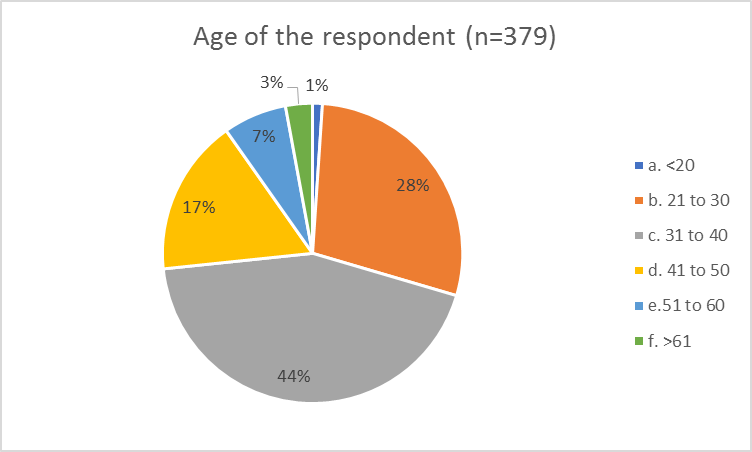
# Respondent’s demography
Age: A little bit less than half of the respondents (44 percent) are between the age of 31 to 40. This is followed by 21 to 30 (28 percent) and 41 to 40 (17 percent).
Gender: Majority of the respondents are male (74 percent). Only 26 percent are female.

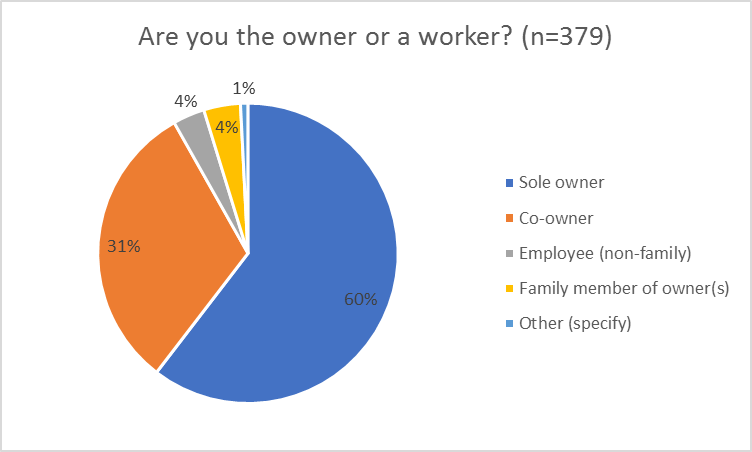
Ownership: Most of the respondents are sole owners (60 percent) followed by co-owner (31 percent).
# Firm Description
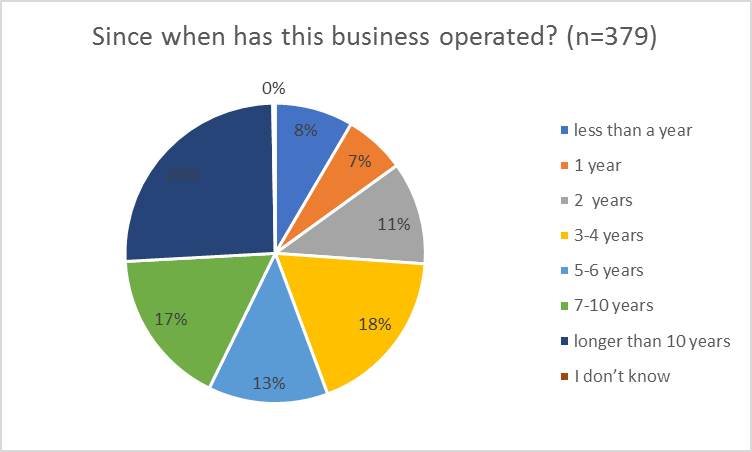
Year of Establishment: Regarding the time when their business has started to operate, 26 percent said “longer than 10 years”; 18 percent said “3-4 years”; 17 percent said “7-10 years” and 11 percent said “2 years”.
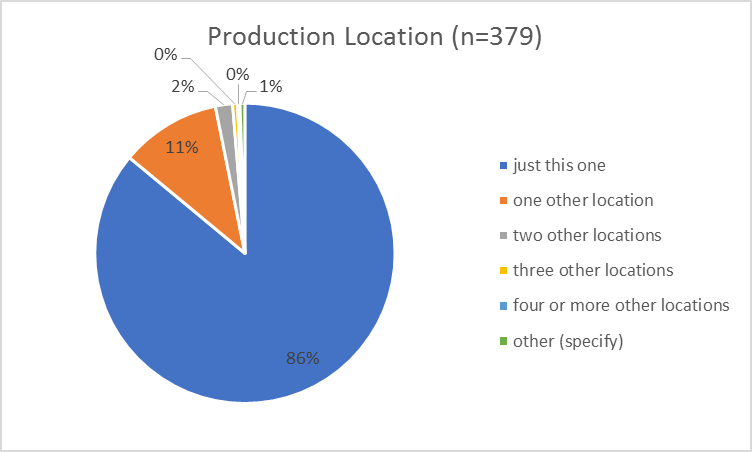
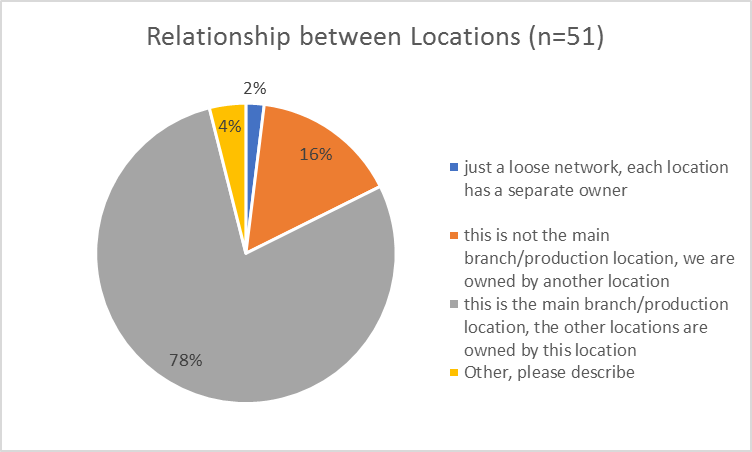
Branches: Most of the businesses who were part of the intake interview have only one location (86 percent). Those who answered to have more than one location were asked the relationship between locations. Most of them answered “this is the main branch/production location, the other locations are owned by this location (78 percent).
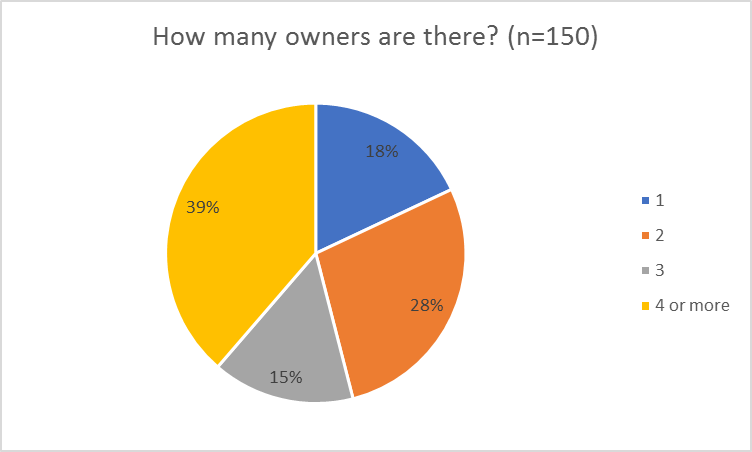
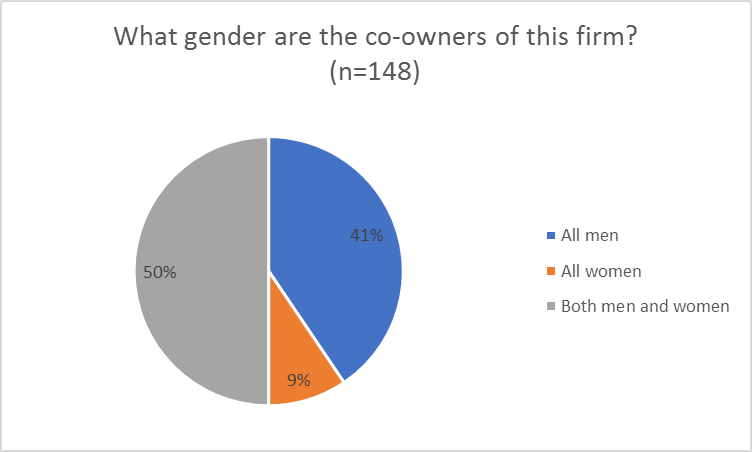
Number of owners: Excluding those respondents who answered “sole owner” were asked the number of owners the firm has. The responses were: 4 or more owners (39 percent); 2 owners (28 percent) and 3 owners (15 percent). With regards to gender of the co-owners for the firm; half of them are both men and women whereas 41 percent are all men.
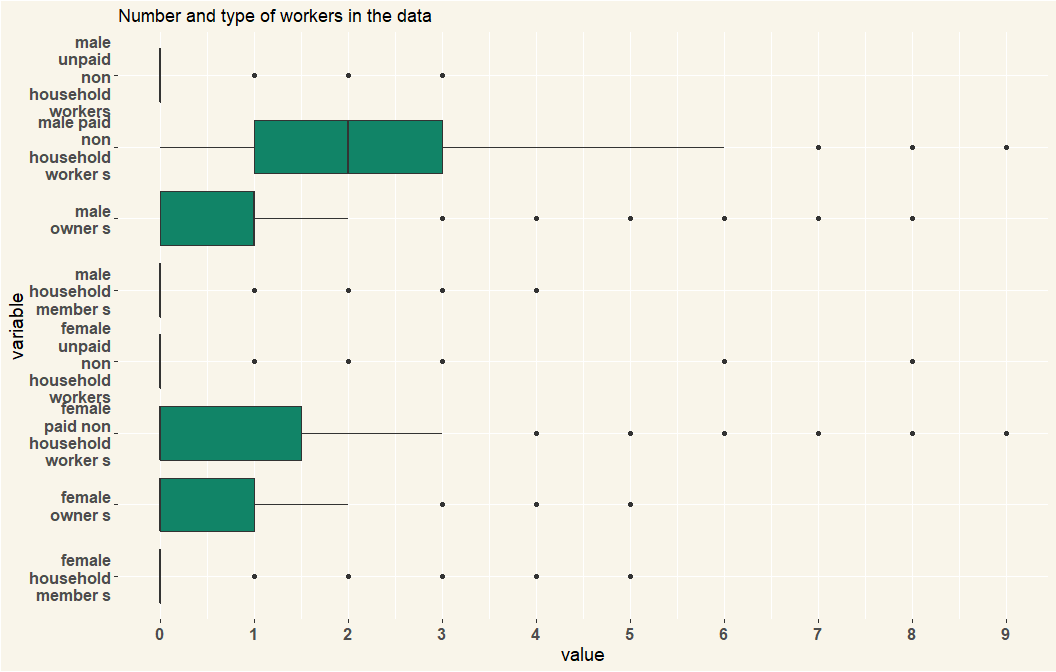
Number and type of workers: There were four categories of workers in the census data. Owners, household workers that were paid and unpaid and paid non household workers. The latter were the ones that were important to the intake analysis since they determined the classification of a business as a small firm. The definition was that a small firm needed to have at least 2 non family paid workers. There were more male paid workers, with the median business having 2 male paid workers. Female paid non household workers have a median of 1 worker per firm.
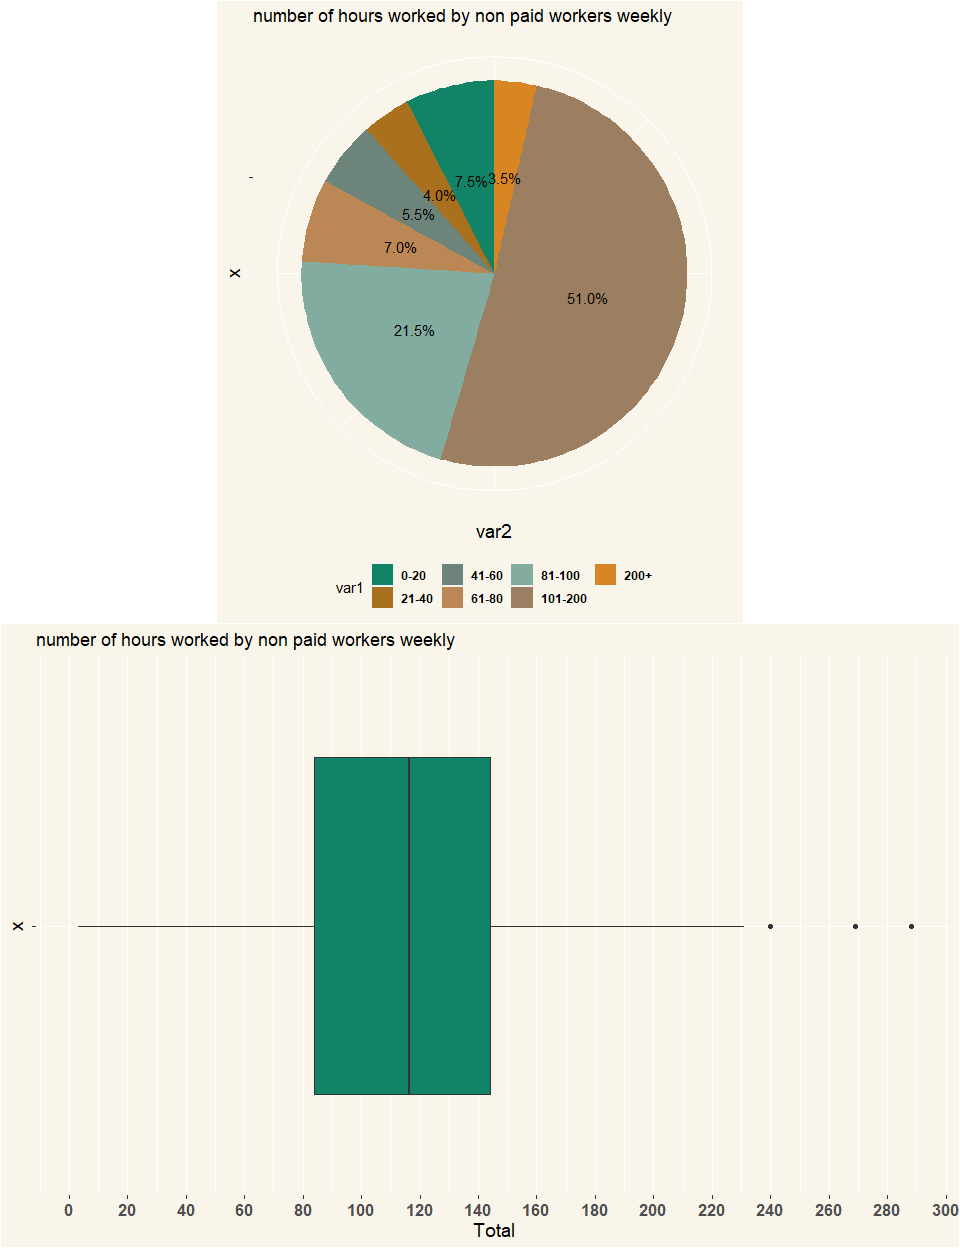
For those companies that had 2, 3 or 4 paid non-household workers, the question came “How many hours does each paid non-household worker work per week (on average)?” The median combined number of hours that two, three or four employees work was 116 hours with a few exceptions. 51% of the firm employees worked for between 100 and 200 hours, 21.5% working 80 – 100 hours working for less hours with 3.5% being outliers that worked for over 200 hours a week.
Those businesses that had 21 to 25 workers, received the follow up question “Do your workers normally work full-time?”. However; there were few responses to this question with only 4 responses all of them being firms whose workers worked full-time.
Lay off workers due to Covid: Interestingly, 75 percent of the respondents said that they did not have to lay off workers due to the impact of COVID-19 pandemic. Just 5 percent laid off 1 worker, 14 percent had to lay off 2-3 workers and another 5 percent laid off 4 or more workers.

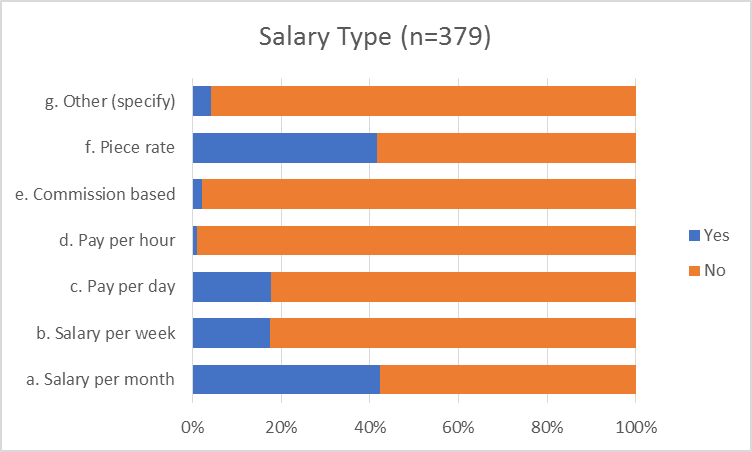
Salary type: Salary per month and piece rate are the most common type of paying workers. Salary per week is used by about one in six firms as is ‘pay per day’.
# Type of Customers
Most of them describe their customers as being mostly individuals (64 percent). This answer is followed by “they are both individuals and institution customers” (30 percent).

Light manufacturing industry is more likely to have customers as mostly individuals compared to other industries.
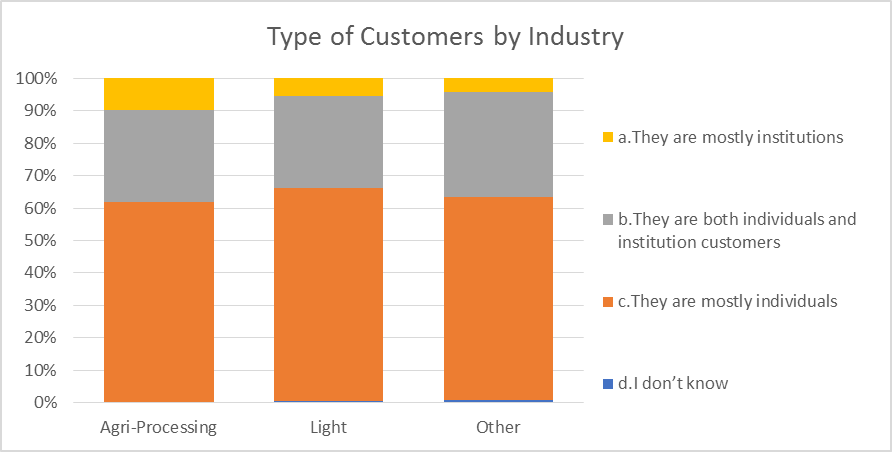
More respondents from Dire Dawa said “their customers are both individuals and institutions” than the other locations.

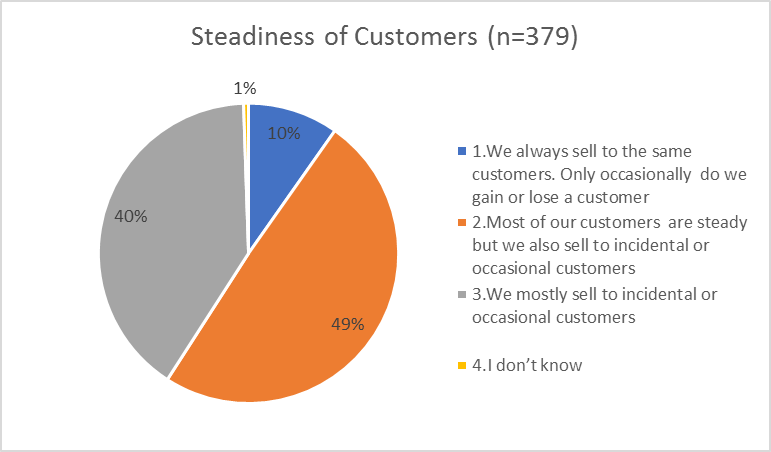
Close to half of the respondents (49 percent) said, their customers are steady but they also sell to incidental or occasional customers. About 40 percent mostly sell to incidental or occasional customers.
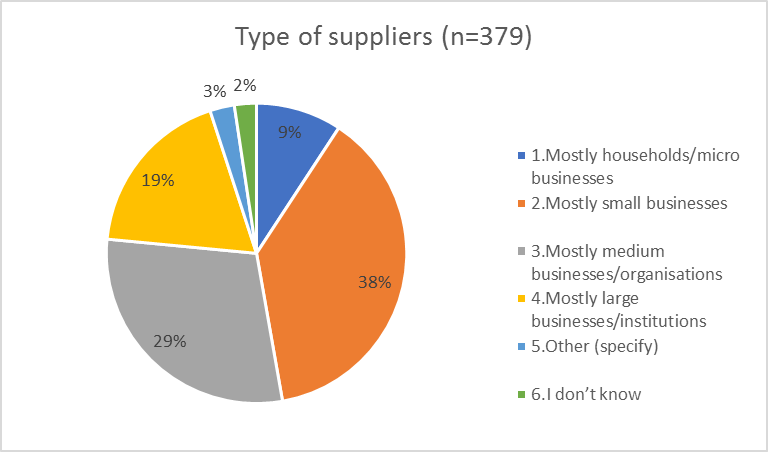
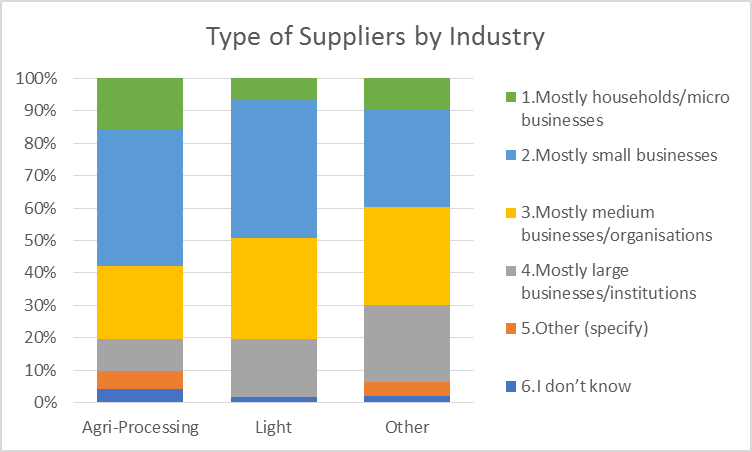
# Type of Suppliers: The type of suppliers is diversified. The most common description is ‘mostly being small businesses’ (38 percent); second most common was ‘mostly being medium businesses/organisations’ (29 percent) and finally ‘mostly being large businesses/institutions’ (19 percent).
Regarding suppliers by sector: for agri-processing and light manufacturing has relatively small businesses as suppliers, while the sector ‘other’ has larger businesses.
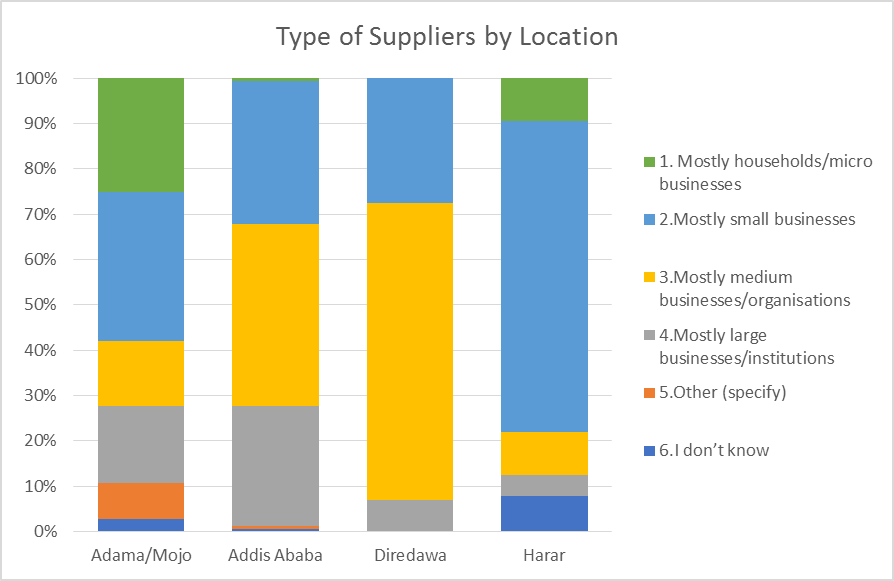
Compared to other locations, firms in Dire Dawa described their suppliers as mostly medium businesses/organizations whereas in Harar, it was described as mostly being small businesses.
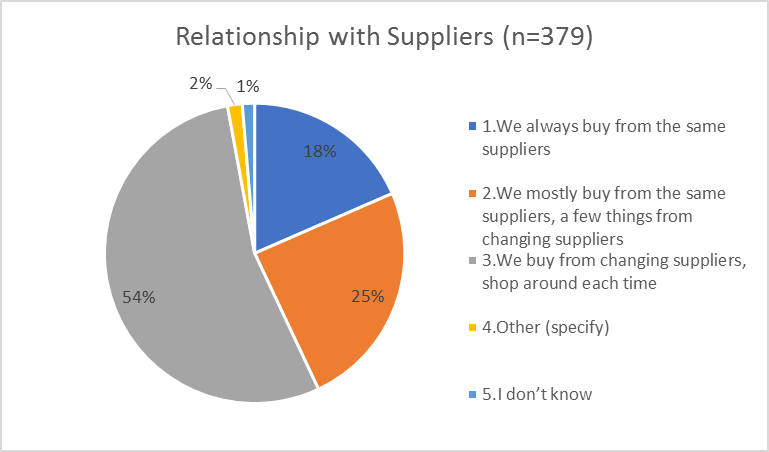
Just over half of the respondents (54 percent) said they buy from changing suppliers, shop around each time. About 25 percent mostly buy from the same suppliers, a few things from changing suppliers.
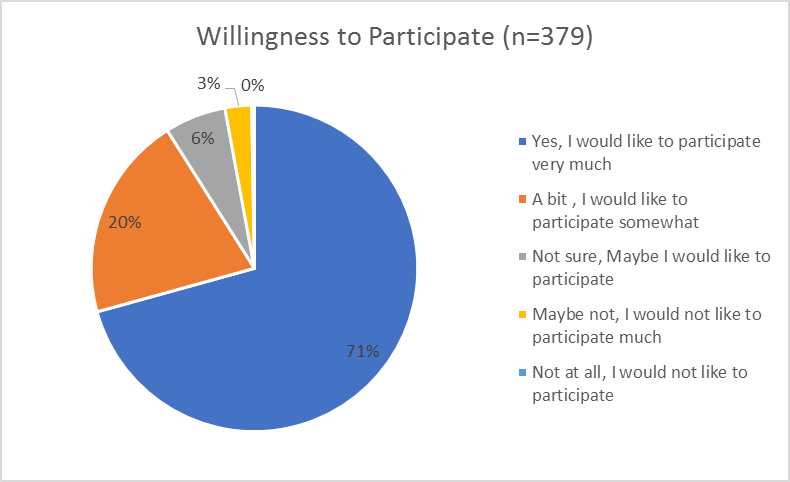
# Willingness to participate in diaries research: About 71 percent of the respondents would like to participate very much. Most of the respondents are also comfortable in sharing confidential information (45 percent-very comfortable and 33 percent-comfortable).

The firms who are co-owned were asked about the other owner’s willingness. About half of the respondents (55 percent) said they would like to participate very much. Correspondingly, 46 percent said, the other owners would like to participate as a respondent.

