
Introduction
Continuous societal development has brought about numerous disruptive phenomena to society that have redefined the organization of virtually every sphere of life. One such disruption is in the field of math and statistics-data revolution. There is a phrase that goes, “data is the new oil” which essentially implies that organizations are starting to recognize the value of data in defining their value proposition. However, leveraging the power of data in decision-making is not as simple as it sounds owing to the large volumes of data being generated every single day. As such, this concern begs the question, “How then does one make sense of all this data?”
Statistics –the science of collecting, analyzing, presenting, and interpreting data- has a lot of cumbersome mathematical underpinnings that inform its use in analytical processes. However, its application is supposed to communicate a story about some particular dataset in terms of the defined measures. In this brief discussion, we look at some of the simplest analytical measures that are used in data analysis.
Mean/average
One of the most intriguing things about the data collected from real-world events is its unevenness. For example, take data collected on students, it’s almost impossible to find identical students on all the data points that you collect. However, if you were to observe the data collected, for instance, narrow it down to one of the data points say age, you find a lot of similarities. Assuming that the chosen sample is a university class, it is possible to find that the majority of students fall between 18 and 24 years of age. Additionally, most students’ age will likely lie towards the middle of this range, say 21. This number (21) is referred to as the mean/average age or a central point in the data and forms one of the most important measures that most analysts use. Interestingly, in different societal spheres like the media, political scene, and academia, the mean or average measure of a particular data is commonly used to paint an image of how such data looks.
Standard deviation
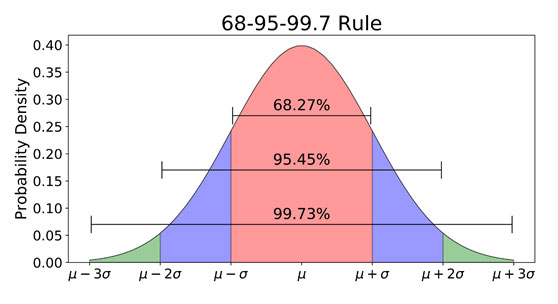
Another important measure is how the data varies from the mean. Suppose one is interested in determining the manner in which specific data points vary/deviate from the determined average, we calculate the standard deviation. These two metrics simply show how dispersed the data is in relation to the mean. In fact, statisticians say that you only need these two measures (mean and standard deviation) to describe any data that is regular or is in a standard format. For instance, it is possible to deduce that 67% of the data lie one unit away from the mean. For instance, suppose we pick a random sample of college students whose average age is 21 years, we can rightly infer that about 67% of them are between 20 and 22 years old if we know the standard deviation is 1.
Normality in data
It is also possible to conclude that 95% of the students have ages between two standard deviations from the mean which is between 19 years and 22 years. This relationship is represented by what we call a normal distribution curve or the bell curve.
Outliers

One of the problems with this analysis is that the data has to be very regular. That means that there should not be outliers in the data; for instance, having way older students (above 35 years) within the pool of students whose mean age is 21 years. One of the most adverse implications of outliers is the distortion of the mean which can be misleading in a report. For data with outliers, the best measure to use is the median. A good example is a company with 4 employees, three earn $100 each month and the fourth is the CEO who earns $10,000 each month. The median salary is $100 but the mean salary is $2,575. The company can report that the mean salary is $2,575, which is misleading to a person who wants to apply there for a role, but the median salary of $100 would be more representative and near what a new employee may expect to earn.
How do we detect the outliers then? Remember the bell curve above: anything that’s two standard deviations away from the mean is an outlier. In our age example, anyone who is 24 years and above or 18 years and below would be an outlier and these are normally removed when reporting or they are reported separately as interesting cases. The mechanics of detecting and removing these outliers are quite involved and depend on the data and the tools in use. However, the best way to encapsulate a data story is by using the common measures which include mean, median, and standard deviation.
To summarize, the mean, median, and standard deviation are pivotal in understanding data. These measures are normally called the measures of central tendency and dispersion and are at the heart of any statistical understanding or analysis.
By John Kamau