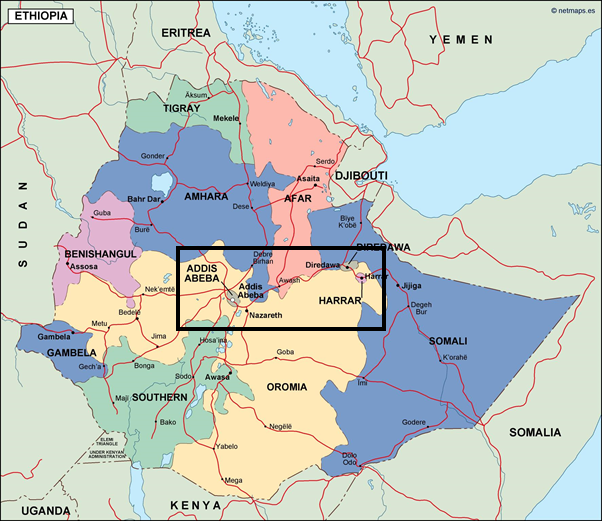
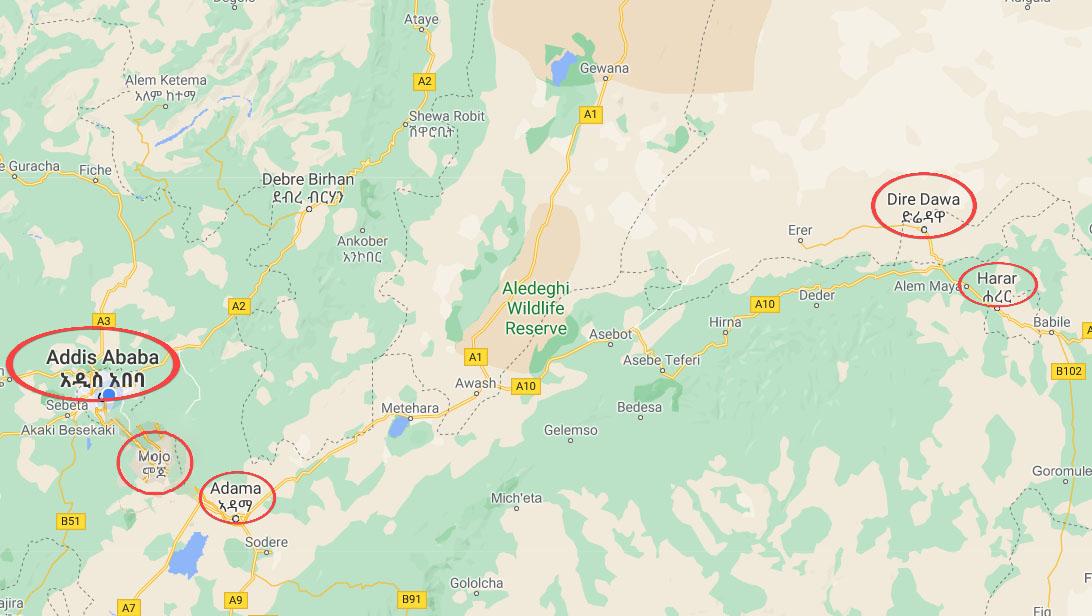
In the first step of sampling businesses for the Small Firm Diaries project, the field research team conducted the census survey of 1399 firms in locations of Addis Ababa, Adama, Dire Dawa and Harar. The locations were chosen based on the requirements of the study. These locations needed to be known for having light-manufacturing and agri-processing firms. Most importantly, these locations needed to be reasonably stable and safe to work in and should be manageable from a logistical point of view. It was decided to include Addis Ababa (the capital, the motor of the economy and having all types of businesses represented), the combination of Adama and Debrezeit was chosen as an area that was easy to reach, safe and expected to be active in agri-processing. We chose Dire Dawa as the third location since it is a sizable town, known for entrepreneurship and distinct from the other two locations in cultural composition and with a long history.
This article describes the results from the Census survey in terms of location; type of businesses, owners’ gender; number of employees of the firms and number of business lines.
# Location distribution: Since Addis Ababa is the capital and the economic centre of the country, it has a large number of small firms. Therefore, we assigned more Field-Researchers to Addis Ababa than the other areas, Addis Ababa has five Field-Researchers, Adama-three, Harar-two and Dire Dawa-one. The census result is more or less a result of this distribution of Field-Researchers. About half of the results (51 percent) of the census was from the capital city-Addis Ababa. This is followed by Adama (25 percent); Harar (17 percent) and Dire Dawa (7 percent).
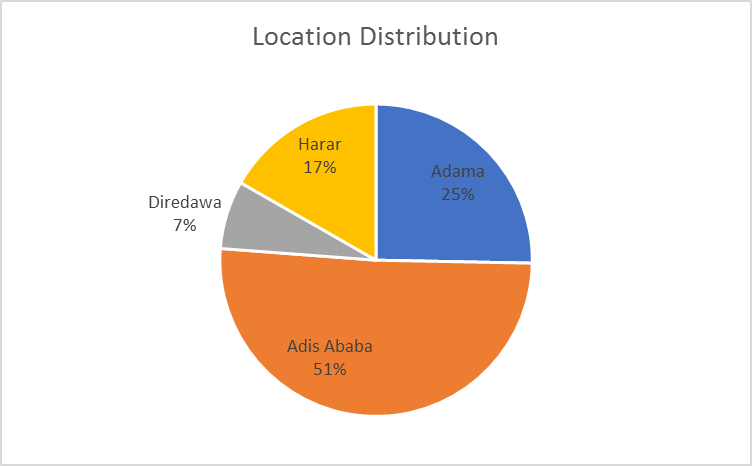
| Location | Number |
| Addis Ababa | 712 |
| Adama | 354 |
| Dire Dawa | 99 |
| Harar | 234 |
# Business sectors: For this study we searched for firms that met a number of eligibility criteria, as described in the first blog. In short, we were looking for firms active in agri-business, light-manufacturing and selected service businesses (here referred to as ‘other’). We excluded the very common businesses of retail, hospitality (restaurant, café, hotel, …) and basic services (hairdressers, tyre mending…). Beyond this focus we included all the businesses that could be found in specified areas, as long as they had at least one worker and no more than 25 workers. The distribution across the three focus areas are about 43 percent of the business firms active in light manufacturing while only 12 percent are agri-processing businesses. The largest group, 46 percent, falls in the “other” category.

| Sector | Number |
| Light Manufacturing | 597 |
| Agri-processing | 162 |
| Other | 640 |
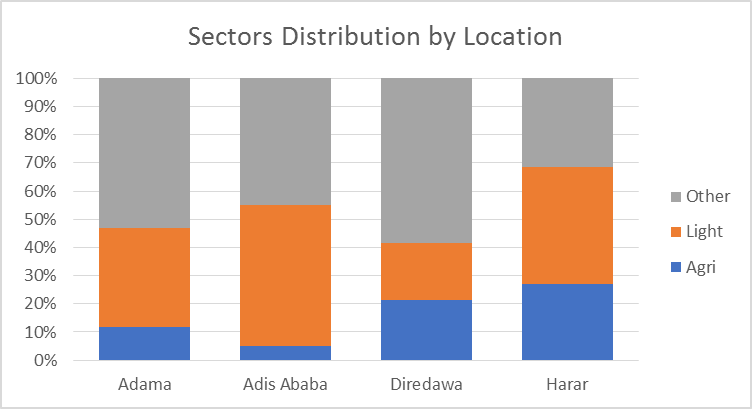
By location, we see that “light manufacturing” is more concentrated in Addis Ababa followed closely by Harar whereas “other businesses” (those providing specific services) are more concentrated in Dire Dawa. Regarding the “agri-processing sector”, this is relatively most common in Harar with 27 percent of the firms in agri-processing. This is followed by Dire Dawa (21 percent); Adama (12 percent) and negligible in Addis Ababa 5 percent).
# Owner’s gender: While the field-team had the explicit assignment to make sure they would cover all available women-owned or co-owned firms; the interviewed firms were mostly male owned (73 percent). Only 19 percent were female owned whereas 7 percent were co-owned, meaning they were owned by both men and women.
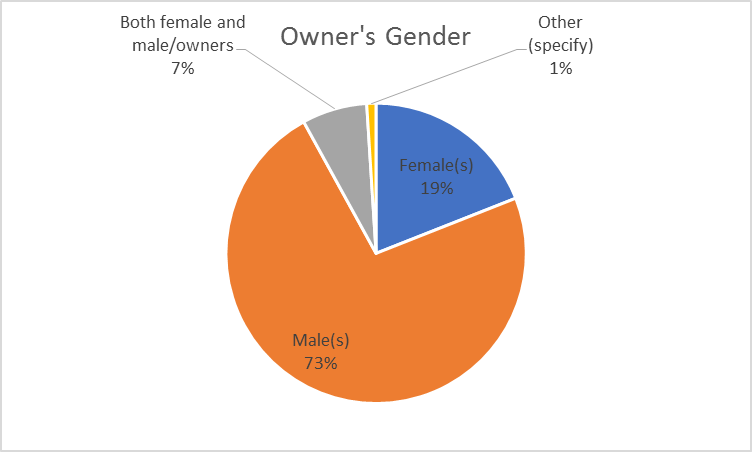
| Owner’s Gender | Number |
| Male owned | 1021 |
| Female owned | 266 |
| Both female and male owned | 98 |
| Other | 14 |
Agri-processing firms are more likely to be owned by women (out of the total agri-businesses, 31 percent are owned by women; 7 percent are co-owned whereas 60 percent are male-owned). Light manufacturing is least likely to be women-owned but has a higher percentage of being male-owned (15 percent are owned by women; 10 percent are co-owned and 75 percent are male owned). The group of ‘other’ has about the same percentage of male-owned, but of the remaining most of the firms are women-owned (20 percent of total) and very few are co-owned (about 4 percent of the total).

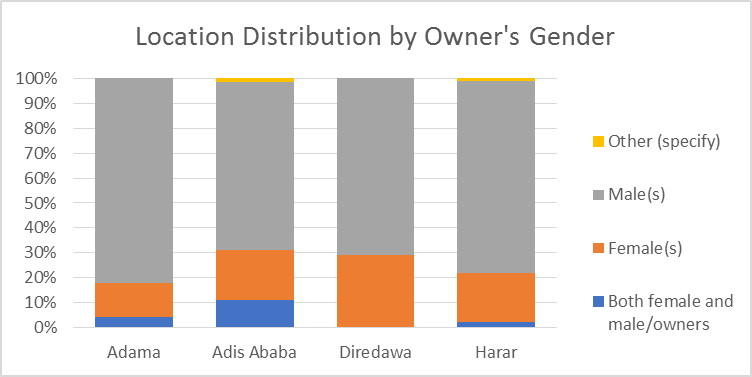
The gender distribution according to location shows that Dire Dawa has the highest percentage of women-owned firms, while Adama has the smallest portion of women-owned firms. Co-owned firms are relatively more common in Addis Ababa.
# Number of employees: While we allowed the Field-Researchers to include all firms with any employees, the field team knew that ultimately, we would only be able to include firms with two or more employees, so it is likely that quite some firms with one employee were already left out of the census. The survey result shows that there are by far more small firms, than larger firms, as we expected. In total of all firms found one-quarter have one employee (25 percent) and one-quarter have two employees (25 percent). Of the firms with more than two employees, most (30 percent of total) have three to five employees. Just 16 percent of all census results have 6 to 20 employees; 2 percent have 21 to 30 employees and another 2 percent have more than 31 employees. Interestingly enough, there is no clear pattern along the owners’ gender regarding size or even much difference according to location.
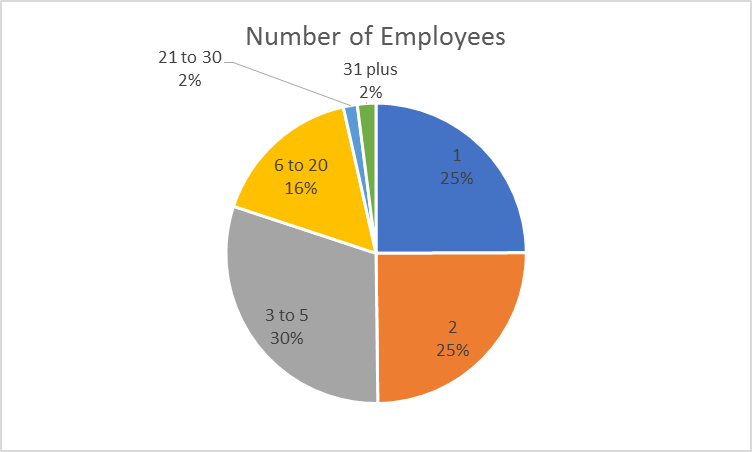
| Number of employees | |||||||
| 1 | 2 | 3 to 5 | 6 to 20 | 21 to 30 | 31 plus | ||
| Owner’s Gender | Female | 84 | 56 | 73 | 43 | 5 | 4 |
| Male | 249 | 270 | 317 | 162 | 10 | 11 | |
| Both Female and Male | 15 | 20 | 32 | 24 | 3 | 3 | |
| Location | Addis Ababa | 183 | 175 | 206 | 115 | 11 | 18 |
| Adama | 67 | 100 | 123 | 59 | 2 | 3 | |
| Dire Dawa | 26 | 22 | 30 | 15 | 2 | 4 | |
| Harar | 72 | 50 | 63 | 40 | 6 | 3 | |
| Sector | Light Manufacturing | 137 | 160 | 188 | 97 | 5 | 7 |
| Agri-processing | 35 | 43 | 54 | 24 | 2 | 3 | |
| Others | 176 | 144 | 180 | 108 | 14 | 18 | |
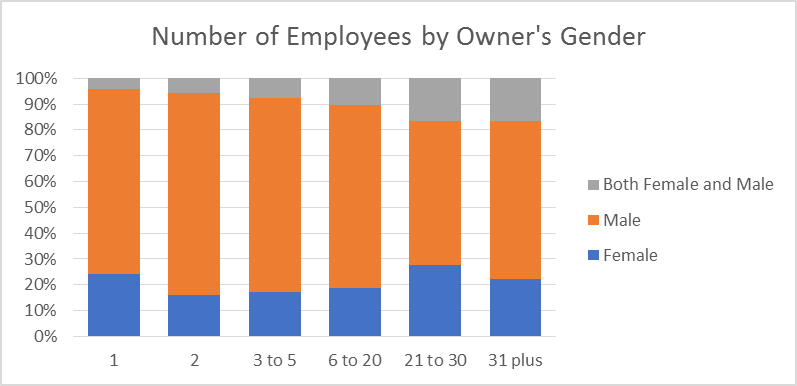
The below graph shows that companies co-owned by both men and women, are more likely to be larger and unlikely to be very small. Women-owned firms are roughly equally distributed across the sizes (slightly more for the smallest of 1 employee, but again also slightly more amongst the >20 employees categories).
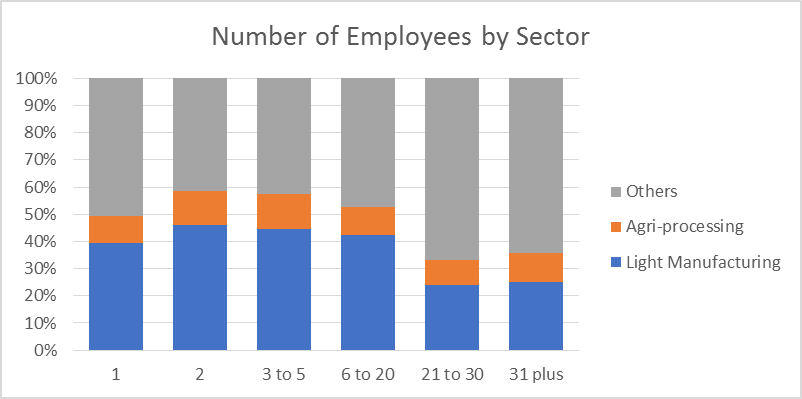
Regarding sector, the service-oriented firms that were included in this study are more likely to be >20 employees. The light-manufacturing are more likely to be <20. The distribution according to sector is quite even for those firms with 1-20 employees.
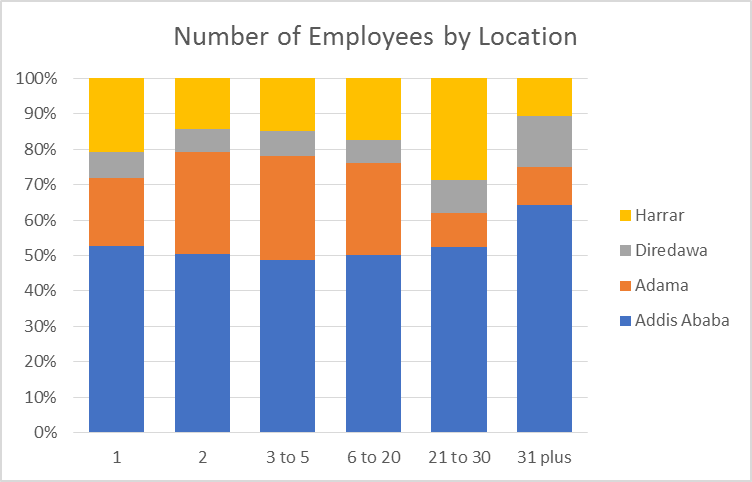
Interestingly enough, the Harar and Dire Dawa firms are more likely to be >20 employees, while the Adama firms are less likely to be >20. Otherwise, the distribution by locations is quite even across sizes for 1-20 employees.
# Number of business lines: About 69 percent of the businesses have only one business line whereas 28 percent have two business lines. More than two business lines is uncommon.
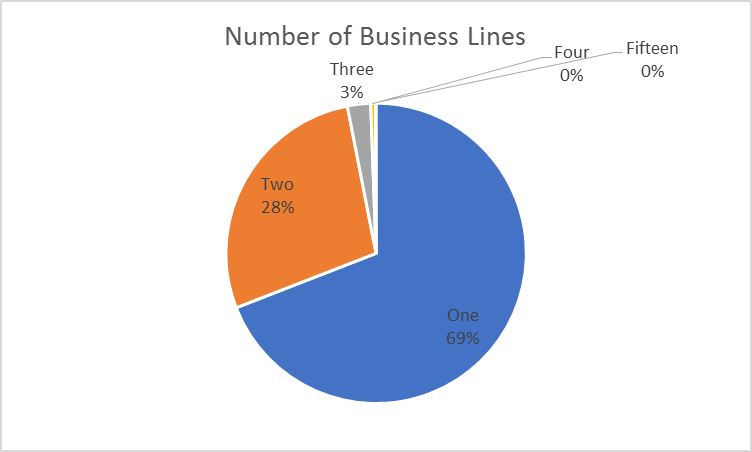
| Number of Business Lines | Number |
| 1 | 966 |
| 2 | 389 |
| 3 | 35 |
| 4 | 7 |
| 15 | 1 |
| Number of Business Lines | ||||||
| 1 | 2 | 3 | 4 | 15 | ||
| Owner’s Gender | Female | 185 | 78 | 3 | 0 | 0 |
| Male | 710 | 284 | 23 | 2 | 1 | |
| Both Female and Male | 66 | 27 | 4 | 1 | 0 | |
| Location | Addis Ababa | 511 | 169 | 25 | 6 | 0 |
| Adama | 233 | 116 | 4 | 0 | 1 | |
| Dire Dawa | 55 | 38 | 5 | 1 | 0 | |
| Harar | 167 | 66 | 1 | 0 | 0 | |
| Sector | Light Manufacturing | 363 | 209 | 20 | 3 | 1 |
| Agri-processing | 72 | 87 | 3 | 0 | 0 | |
| Others | 531 | 93 | 12 | 4 | 0 | |
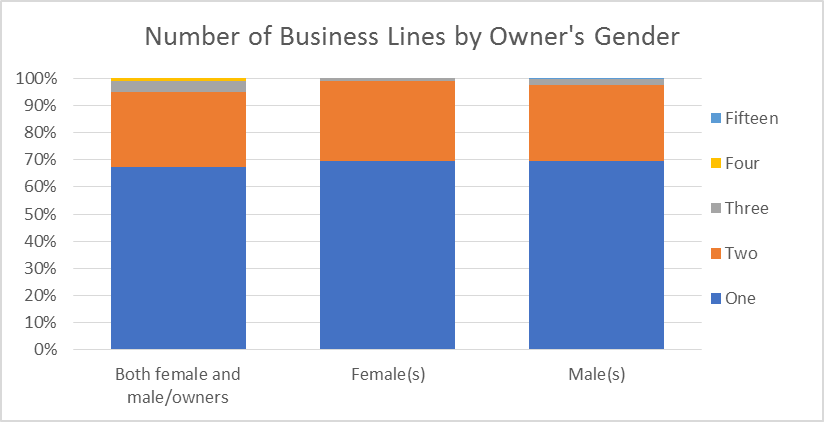
From the graph it is clear that there is almost no difference in the number of business lines by gender. Only co-owned companies are slightly more likely to have multiple business lines.
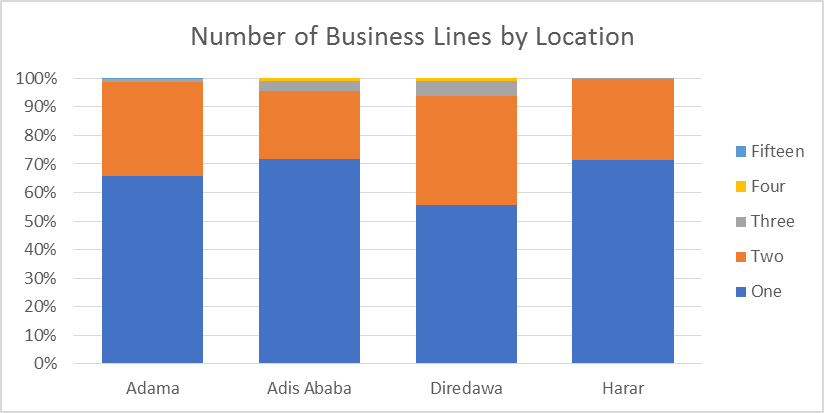
The graph shows that it is more common to have one business line across the locations. However, two business lines are mostly common for Dire Dawa (38 percent) and Adama (33 percent).
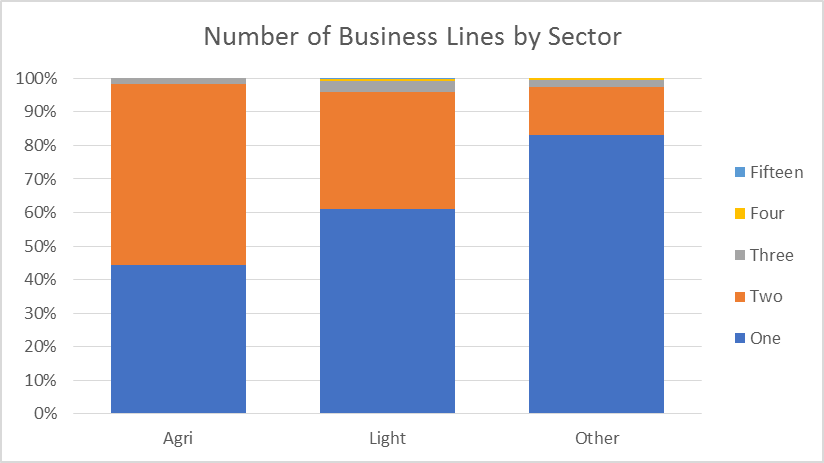
By sector, we see that agri-processing businesses have relatively more often two business lines, whereas for ‘other’ two business lines is least common (out of all agri-businesses 44 percent have one business line; 54 percent have 2 business lines and 2 percent have three business lines. For light manufacturing: 61 percent have one business line; 35 percent have two business lines and 3 percent have three business lines).
# Whether all the businesses are in one or more locations: Most of the businesses (85 percent) are in one location; only few have their sales point and production place in different locations.
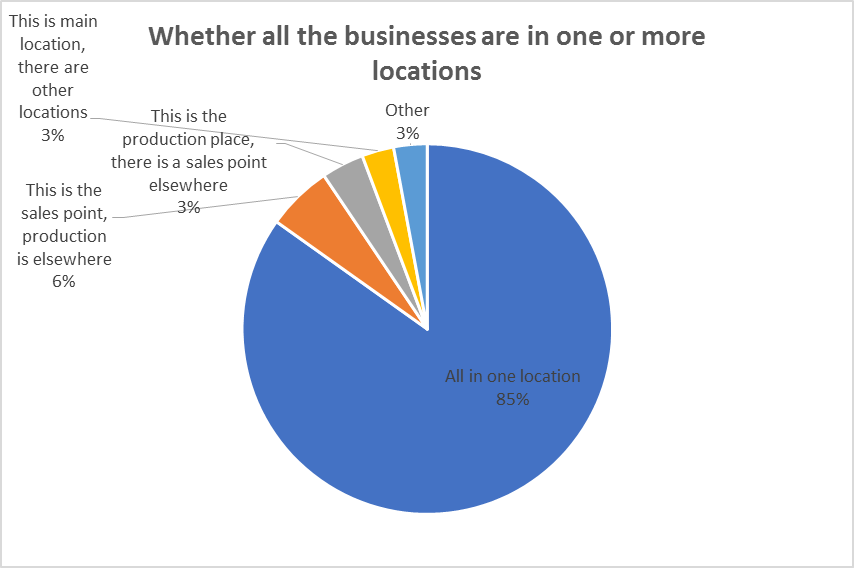
| Number | |
| All in one location | 1187 |
| This is the sales point, production is elsewhere | 80 |
| This is the production place, there is a sales point elsewhere | 52 |
| This is main location, there are other locations | 39 |
| Other | 41 |
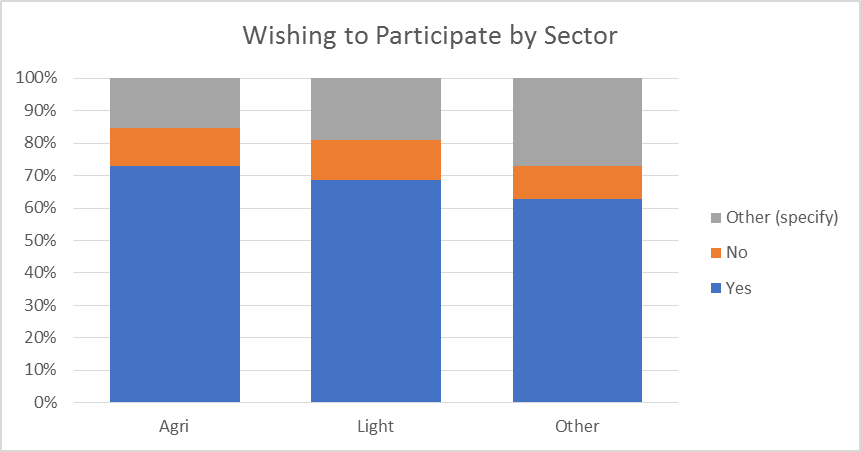
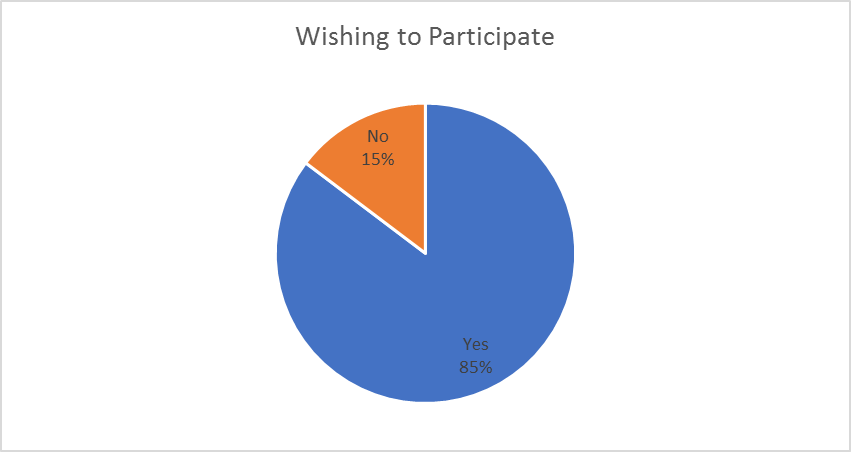
# Wishing to participate: We asked interviewees whether they wish to participate in the diaries project. About 85 percent have agreed to participate and 15 percent refused to participate.
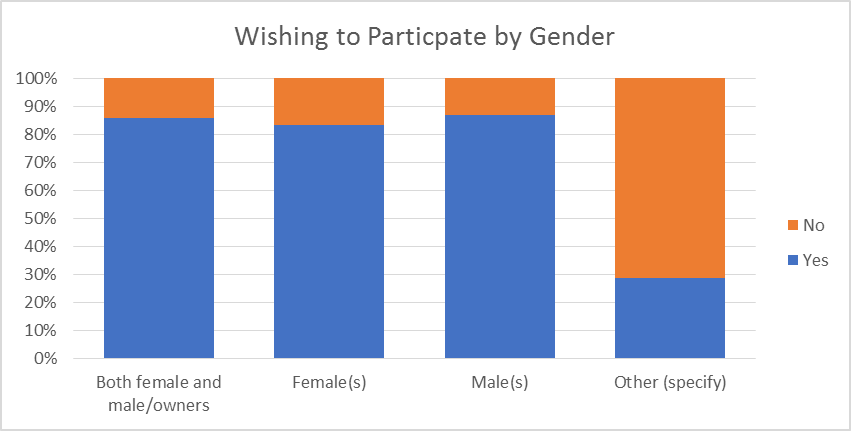
Agreeing to participate is similar by gender. 67 percent of men agreed to participate whereas 66 percent of women agreed to participate in the project.
There were more refusals in Dire Dawa and Addis Ababa compared to Harar and Adama. About 26 percent said “No” in Dire Dawa and 14 percent said “No” in Addis Ababa whereas only 3 percent refused in Adama and 11 percent in Harar.

There is no significant difference in wishing to participate by sector.